
Page 9 - 2018 Annual Report Taiwan Intellectual Property Office
P. 9
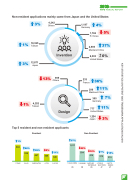
     TIPO ANNUAL REPORT Non-resident applications mainly came from Japan and the United States
 3%
18,365
Taiwan
12,871
Japan
4,242
Others
Germany     4% 1,766
R. Korea
 1,197
       5%
                1% 3%
2,595 37% Mainland China
6,393     -+ 0% United States
36% 11%
Mainland China
7%
Germany
777     11% United States
         Invention
     13% 995 Others
Design
233
France
296
                 305
  1%
4,252
Taiwan
     1,224
    Top 5 resident and non-resident applicants
Japan 3% Non-Resident
   1%
Resident
28%
67%
1 QUALCOMM
    1,011
 944
  66%
2%
22%
2 ALIBABA
10%
3 APPLIED MATERIALS
             11%
7%
4 TOKYO ELECTRON
15%
5 NITTO DENKO
 594
      538
    447
416
   426
345
372
  315
   1 TSMC
2 AUO
3 MEDIATEK
4 ITRI
5 ACER
US CN US JP JP
 7
KEY STATISTICS ON PATENT AND TRADEMARK APPLICATIONS IN 2018
