
Page 10 - 2018 Annual Report Taiwan Intellectual Property Office
P. 10
Trademark
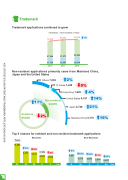
Trademark applications continued to grow
Residents Non-residents Total
83,802
61,215 21,752 22,587
2016 2017
84,816 1%
59,840 24,976
2018
79,300
57,548
Non-resident applications primarily came from Mainland China, Japan and the United States
Others 7,202 2% R. Korea 1,440
Hong Kong 1,649 United States 4,187
Non-residents 24,976
Residents 2% 59,840
5%
4% 14%
11%
21%
Japan 4,728
Mainland China 5,770 19%
Top 5 classes for resident and non-resident trademark applications
-+ 0% 10,586
2%
Resident
Non-Resident
19% 18% 1%
5%
-+0% 5%
9%
4,831
6,479
5,910
4,343
4,099
25%
35 43 30 5 3 Class
3,270
3,087
9 35 3 5 42
Class
2,514
2,027
8
KEY STATISTICS ON PATENT AND TRADEMARK APPLICATIONS IN 2018
