
Page 20 - 2018 Annual Report Taiwan Intellectual Property Office
P. 20
02
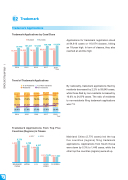
Trademark Applications
Trademark Applications by Case/Class
By Case By Class
97,776 101,327 101,331 108,758 110,074
Trademark
.
2014 2015 2016 2017 2018 Year
75,933 78,523 79,300 83,802
84,816
Applications for trademark registration stood at 84,816 cases or 110,074 classes, hitting an 18-year high. In term of classes, they also reached an all-time high.
Trend of Trademark Applications
% of Residents % of Non-residents Residents Non-residents
61,215
By nationality, trademark applications filed by
56,217
74.0%
19,716
2014
57,356
2015
57,548
residents decreased by 2.2% to 59,840 cases, 59,840 while those filed by non-residents increased by
73.0%
21,167
72.6% 73.0% 70.6%
10.6% to 24,976 cases. The ratio of residents to non-residents filing trademark applications was 7:3.
21,752
22,587 24,976
29.4%
26.0%
27.0%
27.4%
27.0%
2016 2017 2018 Year
Trademark Applications from Top Five Countries (Regions) in Taiwan
5,770
4,830
MAINLAND CHINA
2017 2018
4,728 4,187
Mainland China (5,770 cases) led the top five countries (regions) filing trademark applications. Applications from South Korea were down by 5.3% to 1,440 cases, while the other top five countries (regions) were all up.
3,892 3,684
JAPAN U. S.
1,579 1,6491,5211,440
HONG R. KOREA KONG
18
I
IPR APPLICATIONS
