
Page 18 - 2018 Annual Report Taiwan Intellectual Property Office
P. 18
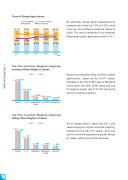
Trend of Design Applications
% of Residents % of Non-residents Residents Non-residents
By nationality, design patent applications by residents went down by 1.0% to 4,252, while those by non-residents remained stable at 3,830. The ratio of residents to non-residents filing design patent applications was 5.3:4.7.
    57.3%
2014
57.0% 54.2%
2015 2016
52.9% 52.6%
47.4%
2017 2018 Year
     4,672
3,476
42.7%
4,450
4,579
3,866
4,293
4,252
3,830
             3,358
45.8%
3,827
47.1%
   43.0%
   .
Top Five Countries (Regions) Applying Invention Patent Rights in Taiwan
2017 2018
12,49712,871
6,408 6,393
      1,8882,5951,864 1,7661,1521,197 U. S. MAINLAND R. KOREA GERMANY
CHINA
Among non-residents filing invention patent applications, Japan led by 12,871 cases, followed by the US (6,393 cases). Mainland China came third with 2,595 cases and had the highest growth rate of 37.4% among the top five countries (regions).
       JAPAN
Top Five Countries (Regions) Applying Design Patent Rights in Taiwan
2017
1,261 1,224
703 777
2018
267 296
As for design patent, Japan led with 1,224 cases among the top five countries (regions), followed by the US (777 cases). All of the top five countries experienced growth except for Japan, which saw a 2.9% decrease.
      286 305
171 233 FRANCE
       JAPAN
U. S.
GERMANY MAINLAND CHINA
 16
I
IPR APPLICATIONS
