
Page 128 - 2018 Annual Report Taiwan Intellectual Property Office
P. 128
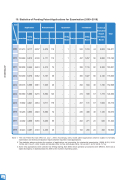
19. Statistics of Pending Patent Applications for Examination (2009~2018)
   Item
Year
Application
  Reexamination
 Opposition
 Invalidation
Technical Evaluation Report for Utility Model
 Total
  Invention
   Utility Model
  Design
 Invention
   Design
 Invention
   Utility Model
  Design
 Invention
  Utility Model
   Design
  2009
 141,213
   8,117
  6,057
 4,676
   119
 -
   1
  -
 522
  1,319
   44
 2,803
  164,871
  2010
  153,969
  9,015
  6,198
  4,171
    112
  -
    1
  -
 497
  1,257
    58
  2,882
   178,160
  2011
160,858
  8,444
 6,224
4,312
  74
-
  -
 -
399
 1,116
  82
2,322
 183,831
  2012
  153,039
  8,376
  6,382
  5,167
    39
  -
    -
  -
 365
  1,027
    68
  2,140
   176,603
  2013
129,318
  6,599
 6,681
7,345
  40
-
  -
 -
292
 844
  49
1,740
 152,908
  2014
 100,580
 5,696
  6,276
 8,592
   143
 -
   -
  -
 274
 599
   67
 1,773
  124,000
  2015
  72,892
  4,641
  4,854
  8,711
    179
  -
    -
  -
 257
  511
    87
  1,584
   93,716
  2016
50,293
  3,953
 4,848
8,390
  72
-
  -
 -
235
 408
  49
1,125
 69,373
  2017
 44,002
 4,859
  5,056
 6,256
   55
 -
   -
  -
 202
 271
   23
 620
  61,344
  2018
 46,443
 3,287
  4,748
 4,436
   45
 -
   -
  -
 162
 266
   24
 492
  59,903
  Note: 1. The new Patent Act took effect on July 1, 2004. Accordingly, utility model patent applications shall be subject to formality examination and technical evaluation reports shall be required in said applications.
2. The statistics above excludes the number of applications not requesting for substantial examination. (2009: 8,501; 2010: 10,705; 2011:12,671; 2012:10,932; 2013:9,959; 2014:10,734; 2015:9,684; 2016: 10,142; 2017: 9,707; 2018: 7,716).
3. Some new applications were collected via E-filing starting April 2008. Since operation procedures were different, there was a slight discrepancy in statistical data for 2008 on the number of pending cases.
 126
APPENDIX
