


 15 / 122

15
II
IPR SERVICES
Examination Results of Invention Patent Applications
Unit: Case, %
2010
2011
2012
2013
2014
Allowance
Cases
15,301
19,555
29,129
38,563
44,359
Percentage
53.7% 53.4% 55.6% 57.3% 63.2%
Rejection
Cases
10,018
14,344
20,407
25,798
23,811
Percentage
35.1% 39.2% 38.9% 38.3% 33.9%
Others (Including
Withdrawals)
Cases
3,207
2,728
2,889
2,985
2,036
Percentage
11.2%
7.4%
5.5%
4.4%
2.9%
Note
1. Percentage is derived from using the number of total disposals as the denominator and allowance, rejection, and
others as the numerators.
2. The number of total disposals includes allowance, rejection, and others.
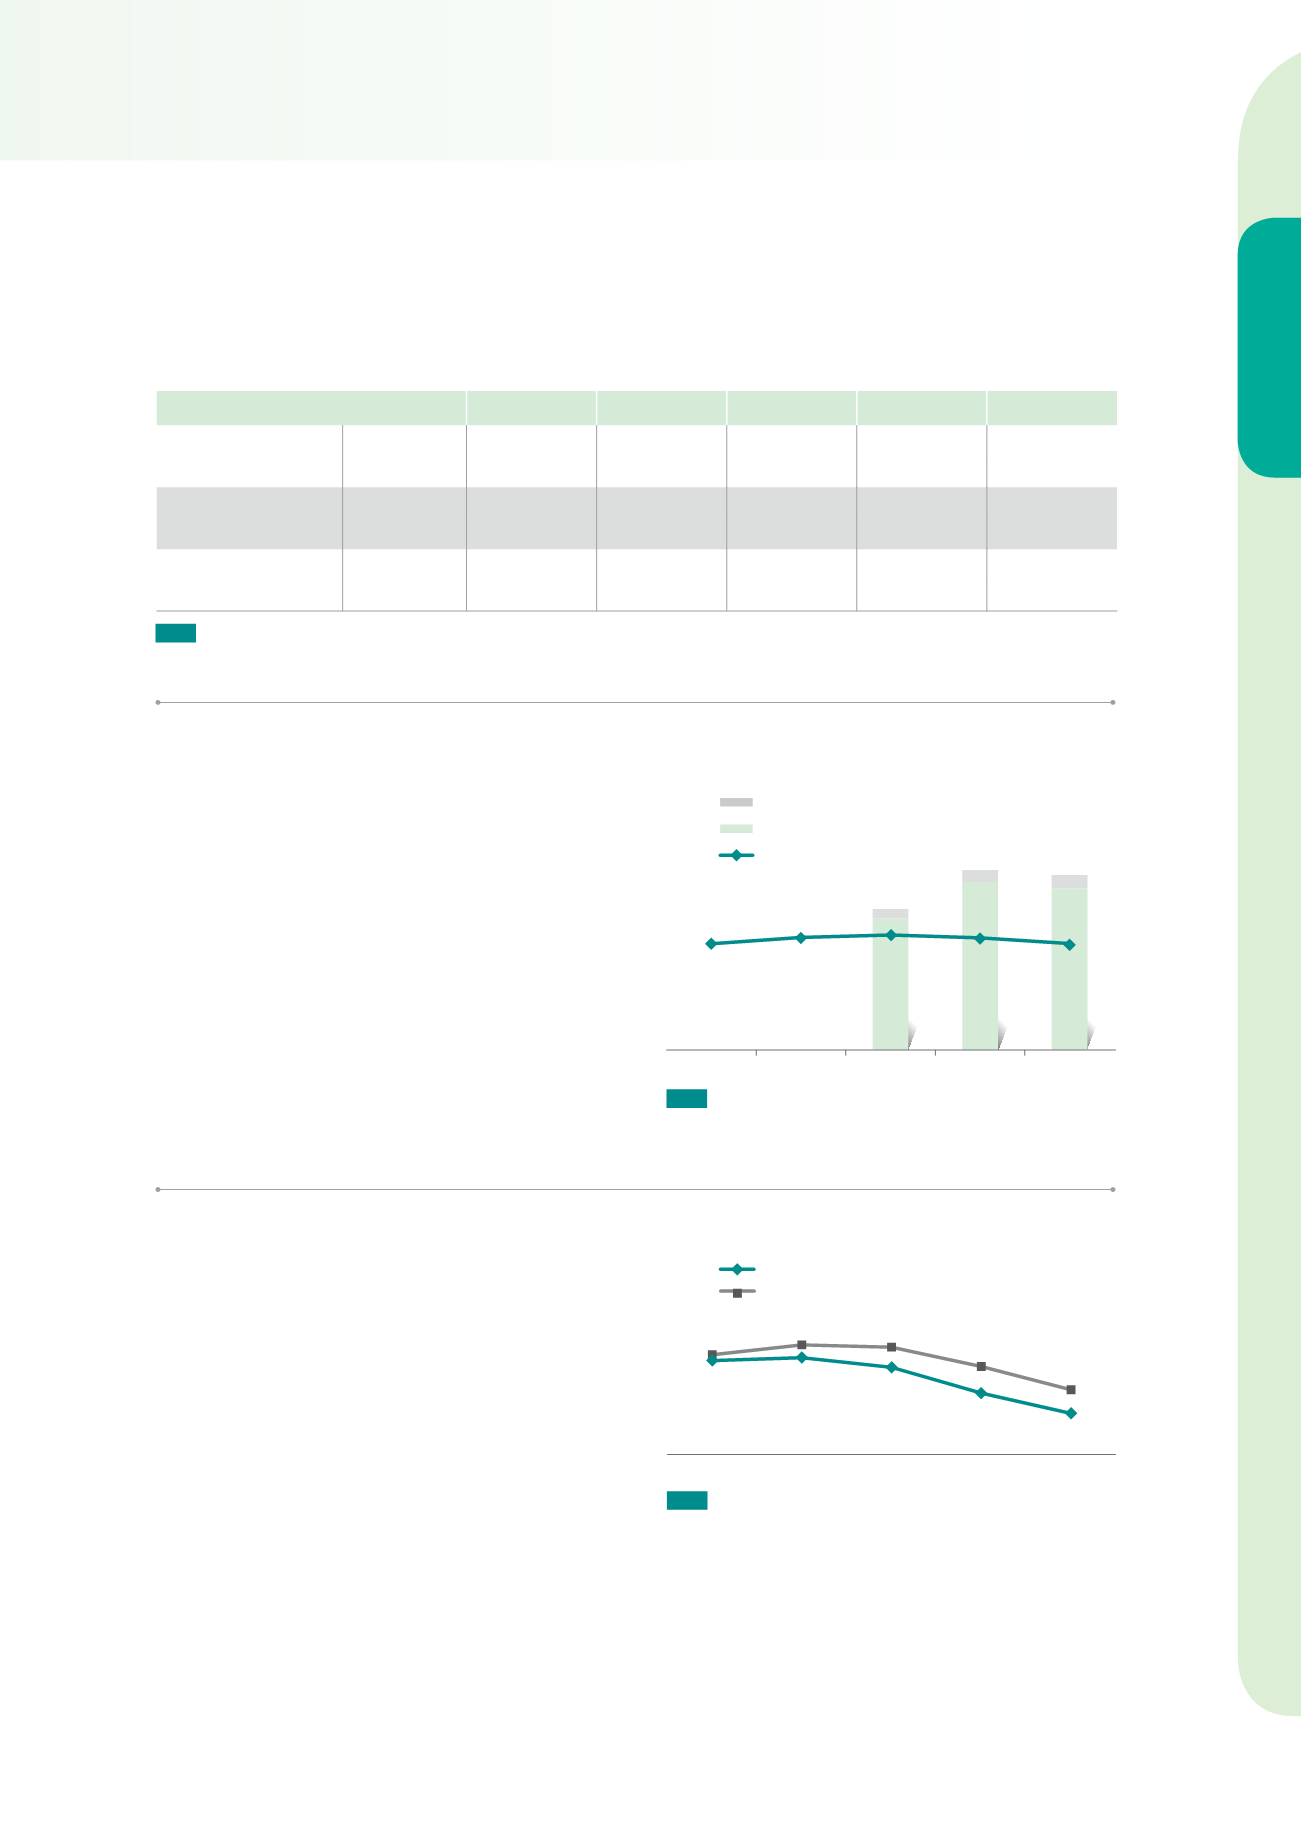
Note
1. “Average First Office Action Pendency” refers to
the average time it takes to process a case from
the time the requests for substantive examination
is made to the time the first office action is issued.
2. “Average Disposal Pendency” refers to the aver-
age time it takes to process a case from the time
the request for substantive examination is made
to the time the decision is issued.
3. Each figure in this chart is an average value in
December of each year.
The average first office action pen-
dency of invention patent applications
has gradually gone down for four con-
secutive years. The average first office
action pendency and the average dis-
posal pendency in December 2014 was
21.2 and 29.7 months, respectively. This
is a respective reduction of 7.3 and 8.4
months from the previous year.
50,873
64,958
62,413
3,580
4,683
5,262
41,115
43,528
44,457
43,395
41,168
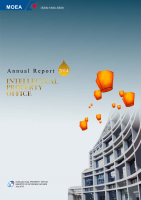
Second (and above) Office Action Issued
First Office Action Issued
Requests for Substantive Examination
Number of Office Actions for Invention
Patent Examination
2010
2011
2012
2013
2014
Note
TIPO’s patent administration system began to differ-
entiate first and second (and above) office actions
for invention patent examination in 2012.
40.3
41.3
37.8
28.5
21.2
42.4
45.9
45.1
38.1
29.7
Average Disposal Pendency (Months)
Pendency for Processing Invention
Patent Examination
Average First Office Action Pendency (Months)
Dec. 2010 Dec. 2011 Dec. 2012 Dec. 2013 Dec. 2014
In 2014, there were a total of 67,675
office actions issued for invention pat-
ent applications, which was a 2.8% de-
crease from the previous year (69,641
cases). There were a total of 5,262 sec-
ond (and above) office actions issued,
which was a 12.4% increase from 2013
(4,683 cases).
Furthermore, with the implementa-
tion of the “final office action” system
on January 1, 2013, a total of 55 final of-
fice actions were issued in 2013, and 73
were issued in 2014.