


 111 / 122

111
APPENDIX
II. Annual
Statistics
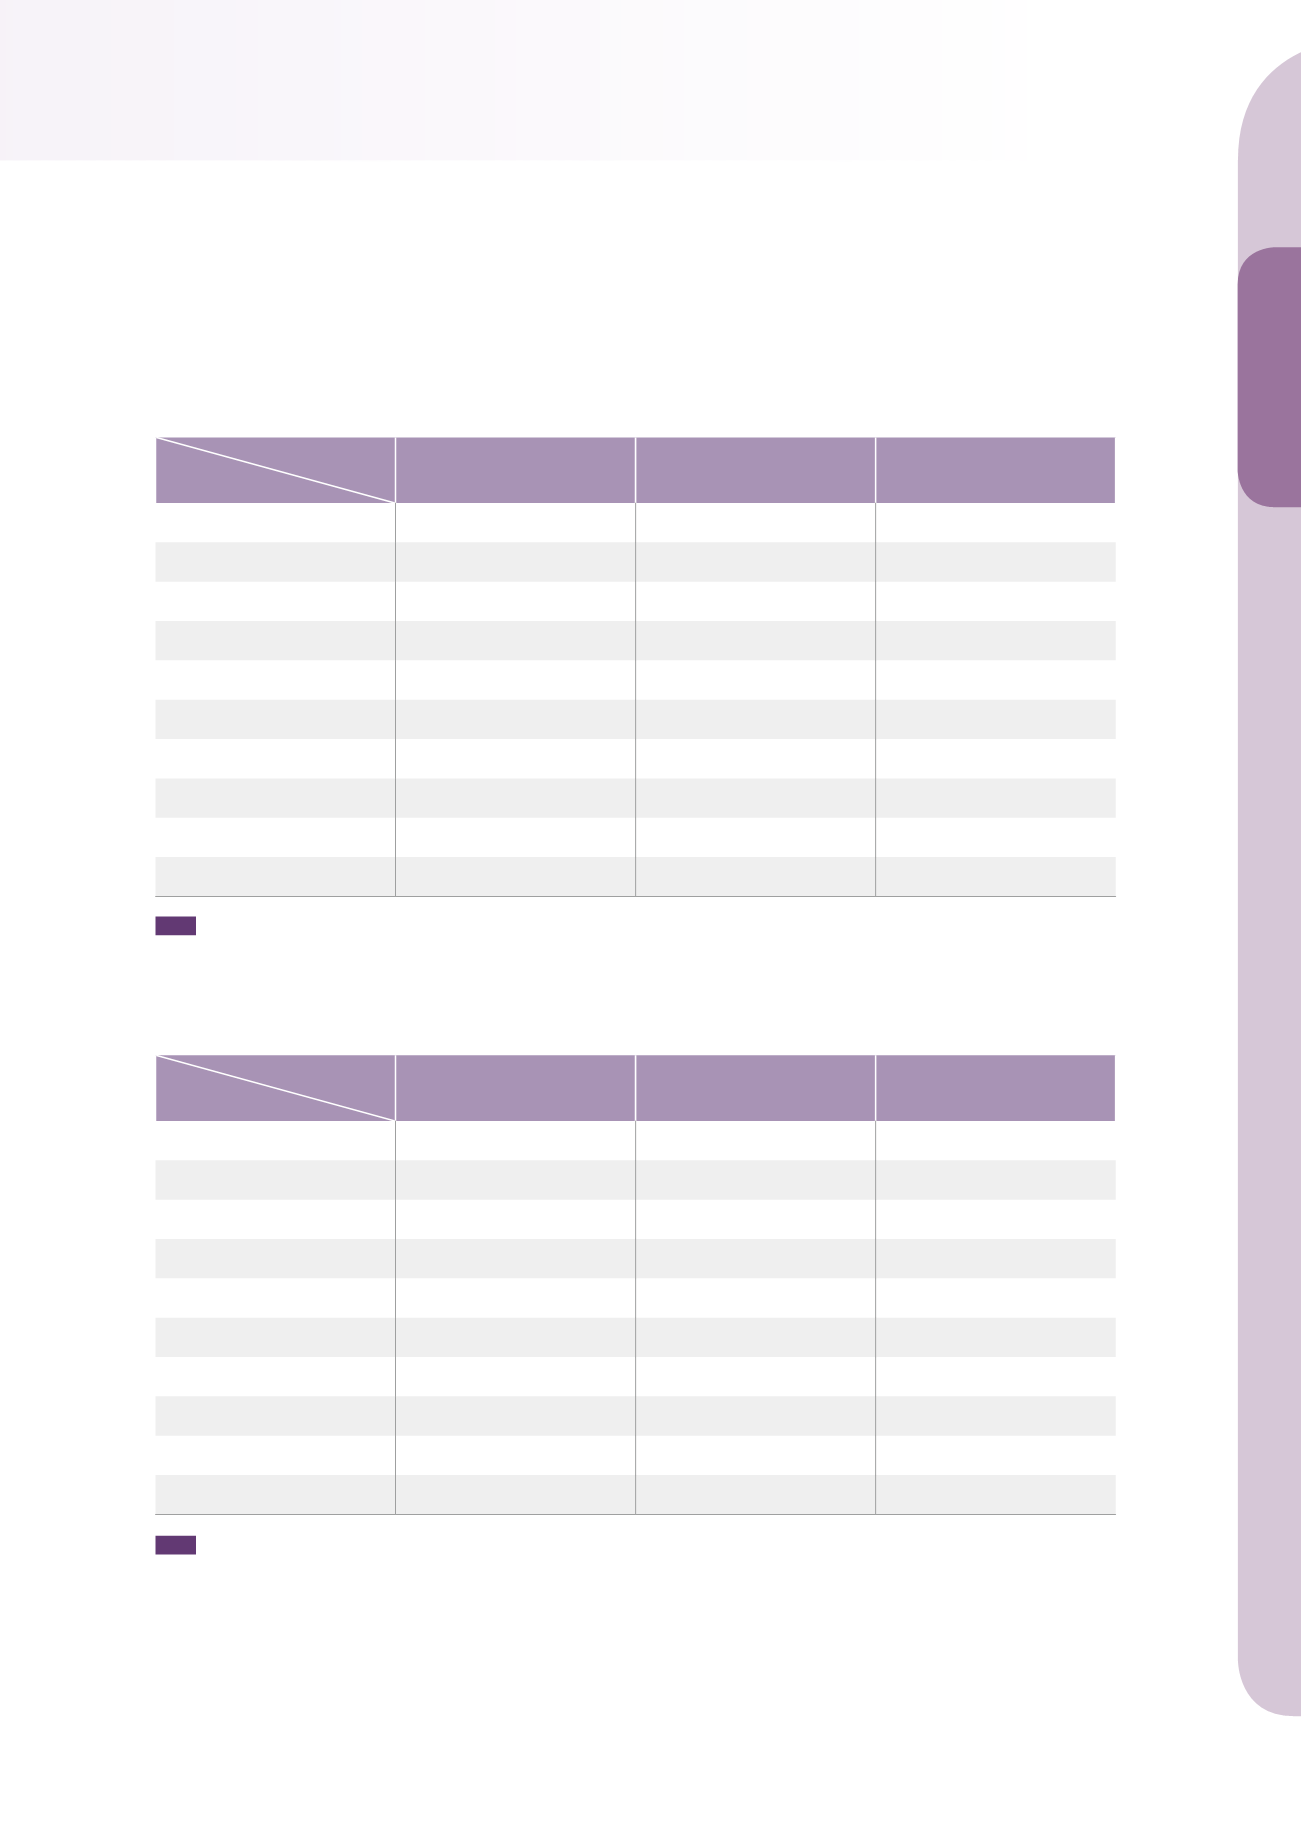
Note
1. The chart reflects the number of cases disposed each year.
2. The item "Others" includes rejection because of formal deficiency, withdrawal, and other type of rejection.
Note
1. The chart reflects the number of cases disposed each year.
2. The item "Others" includes rejection because of formal deficiency, withdrawal, application for identifying the scope of
designated goods or services, and other type of rejection.
2. Trademark Opposition
Item
Year
Sustained
Denied
Others
2005
255
180
76
2006
267
135
65
2007
227
110
91
2008
241
94
76
2009
295
149
107
2010
220
76
91
2011
194
50
122
2012
130
70
129
2013
116
130
89
2014
108
75
101
Item
Year
Sustained
Denied
Others
2005
804
520
231
2006
804
445
199
2007
854
478
243
2008
705
282
268
2009
753
295
256
2010
514
195
223
2011
436
124
260
2012
324
177
250
2013
421
377
273
2014
427
265
216
3. Trademark Invalidation