
Page 26 - 2018 Annual Report Taiwan Intellectual Property Office
P. 26
As shown in the table, disposals included 7,530 allowances (accounting for 89.8%), 614 rejections (7.3%) and 242 others (2.9%). The ratio of allowance and rejection remained stable.
Pendency for Processing Examination of Design Patent Applications
Average First Office Action Pendency (Months) Average Disposal Pendency (Months)
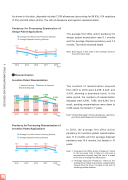
The average first office action pendency for design patent examination was 6.1 months and the average disposal pendency was 7.4 months. The trend remained stable.
Note: Each figure in this chart is the average value for the end of each year.
9.3
7.7
2014
8.7
6.8
6.9
5.3
7.1 7.4
6.0 6.1
2017 2018 Year
.
2015 2016
Reexamination
Invention Patent Reexamination
Number Pending Overall Disposals
Number of Requests
The numbers of reexamination requests from 2016 to 2018 were 6,239, 5,343, and 4,430, showing a downward trend. In the
7,459
6,244 same period, the numbers of reexamination
6,973
5,721
8,592
6,667
6,551
8,711
6,560
6,239
8,390
2014 2015
2016 2017 2018 Year
disposals were 6,560, 7,459, and 6,244. As a result, pending reexaminations were down to 4,436 cases, the lowest in 7 years.
Note: "Overall Disposals" include allowances, rejections, and others (withdrawal and not accepted).
In 2018, the average first office action pendency for invention patent reexamination was 11.9 months and the average disposal pendency was 14.4 months, the fastest in 10 years.
Note: 1. "Average First Office Action Pendency" refers to the average time it takes to process a reexamination request from the time it is made to the time of issuing first office action.
2. "Average Disposal Pendency" refers to the average time it takes to process a reexamination request from the time it is made to the time of rendering written decision.
Pendency for Processing Reexamination of Invention Patent Applications
Average First Office Action Pendency (Months) Average Disposal Pendency (Months)
15.7 15.8 15.6 16.2 14.4
5,343
6,256
4,430
4,436
14.3
13.9 13.6 14.4 11.9
2014 2015 2016 2017 2018 Year
24
II
IPR EXAMINATIONS AND SERVICES
