


 9 / 122

I
9
IPR APPLICATIONS
96.5% 95.7% 95.3% 95.3% 94.2%
3.5% 4.3% 4.7% 4.7% 5.8%
24,917
24,094
24,427
23,837
22,135
915
1,076
1,209
1,188
1,353
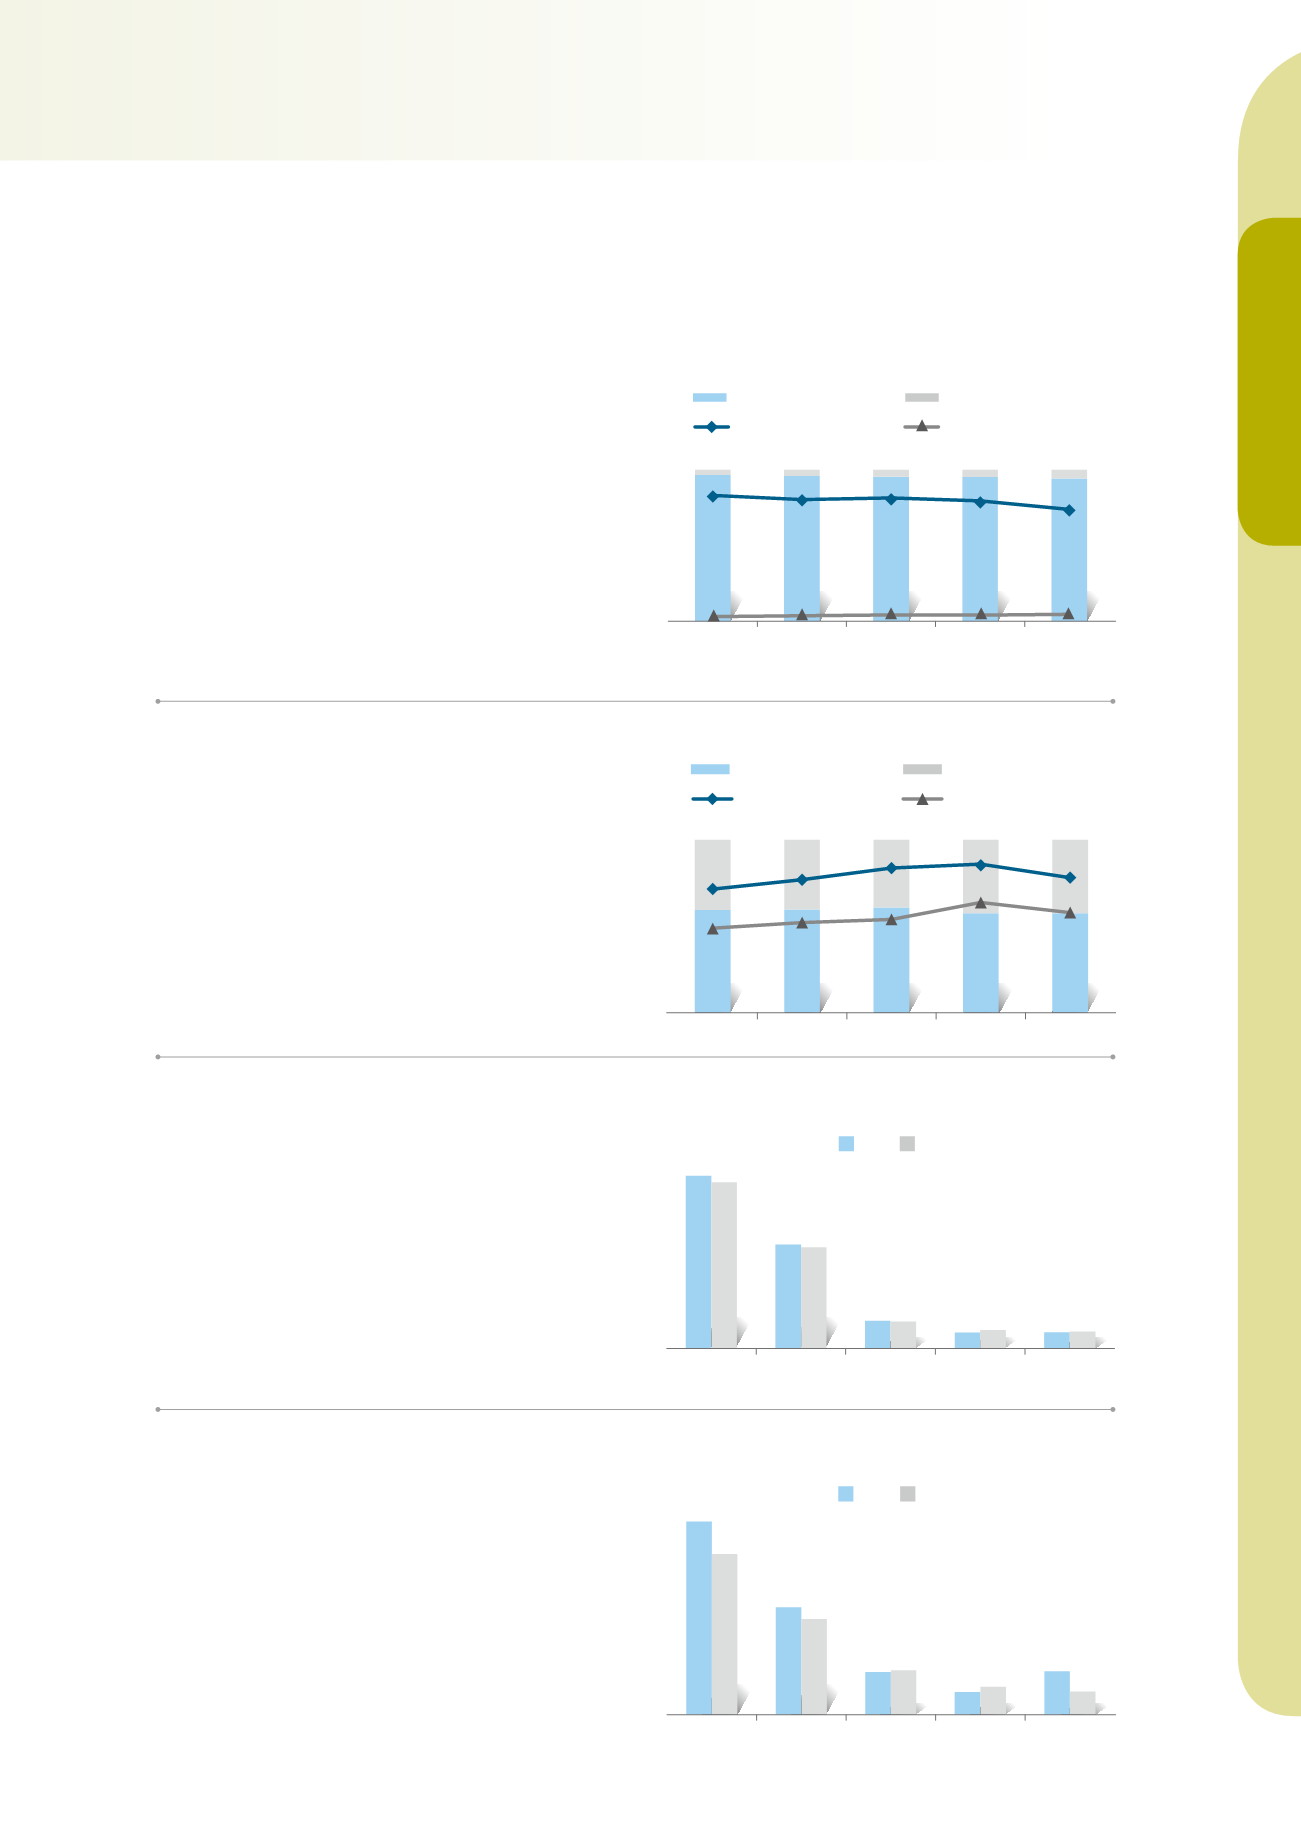
Trend of Utility Model Applications
% of Taiwan Nationals
% of Foreign Nationals
Taiwan Nationals
Foreign Nationals
2010
2011
2012
2013
2014
Though the number of utility model
applications by Taiwan nationals (22,135
cases) accounted for more than 90% of
the utility model applications received,
and is the highest percentage among
all three types of patent applications,
the number of applications still dropped
by 7.1% from the previous year. Ap-
plications from foreign nationals (1,353
cases), however, increased by 13.9%.
59.3% 59.6% 60.8% 57.4% 57.4%
40.7% 40.4% 39.2% 42.6% 42.6%
4,285
4,609
5,011
5,147
4,679
2,935
3,127
3,237
3,821
3,469
% of Taiwan Nationals
% of Foreign Nationals
Taiwan Nationals
Foreign Nationals
Trend of Design Applications
2010
2011
2012
2013
2014
12,419
7,475
1,997
1,147
1,164
11,945
7,276
1,937
1,319
1,209
JAPAN
U.S.A.
R. KOREA MAINLAND
CHINA
GERMANY
2013 2014
Top Five Nations (Regions) Applying
Invention Patent Rights in Taiwan
1,428
795
316
167
321
1,188
706
329
206
171
JAPAN
U.S.A.
GERMANY SWITZERLAND R. KOREA
2013 2014
Top Five Nations (Regions) Applying
Design Patent Rights in Taiwan
There was a decrease of 9.1% and
9.2% in the respective number of design
applications by Taiwan nationals (4,679
cases) and foreign nationals (3,469 cas-
es) from the previous year. However, the
ratios of Taiwan and foreign applica-
tions to overall design applications were
the same as 2013.
The top three nations applying for
invention patents in Taiwan in 2014 were
Japan (11,945 cases), the USA (7,276
cases), and Korea (1,937 cases), with
respective decrease of approximately
2.7% to 3.8%.
I n des ign appl i cat i ons , Japan
topped all nations with 1,188 cases, and
the USA followed with 706 cases. How-
ever, both countries had a respective
decrease of 16.8% and 11.2%.